OS/2 API Trace allows you to trace the 16-bit and 32-bit OS/2 APIs used by any application running on any 32-bit version of OS/2 (2.0 or later) without requiring the application's source code or requiring the application to be recompiled/relinked.
Follow us!
Help us and contribute to eCSoft/2 site hosting
OS/2 API Trace
Version:
2.45.40
Release date:
Monday, 12 June, 1995
Categories:
License:
- Freeware
Interface:
- PMShell
- Workplace Shell
Manual installation
Program is distributed as ZIP package: download to temporary directory and unpack to destination folder. See below for download link(s).
Following ones are the download links for manual installation:
| OS/2 API Trace v. 2.45.40 (25/10/2010, Dave Blaschke) | Readme/What's new |
Operating System/2 API Trace
Author : Dave Blaschke
IBM Austin, Texas
Internal - Dave Blaschke/Austin/IBM@IBMUS
External - blaschke@us.ibm.com
Description : Enables, customizes, controls and summarizes the tracing of
OS/2 APIs imported by a 16-bit or 32-bit executable file
without affecting its source code or requiring recompiling
or relinking.
The first feat, trace enabling, is accomplished by
processing each entry in the table of strings within the
executable file that contains the names of the imported
DLLs. If the entry represents one of the supported OS/2
DLLs and the user requested enablement of API tracing for
this DLL, the entry is replaced with the name of the
appropriate trace DLL. When the executable file is
invoked, the trace DLL intercepts API calls to its
corresponding OS/2 DLL, logs API input information, invokes
the API, and logs API output information. If the entry
represents one of the trace DLLs and the user requested
disablement of API tracing for this DLL, the entry is
replaced with the name of the supported OS/2 DLL. When
finished, the updated table of strings is written to the
executable file.
NOTE: All private APIs are simply forwarded to the
corresponding OS/2 DLL with no intervention from the trace
DLL.
The user can request enablement of API tracing by
specifying the -ON option or can request disablement of API
tracing by specifying the -OFF option. The user can
request enablement or disablement of API tracing for one or
more of the supported DLLs individually by specifying each
DLL's name as an option, or can request enablement or
disablement of API tracing for all supported DLLs by
specifying the -ALL option. The user can request to
preserve the executable file's date and time stamp by
specifying the -P option.
NOTE: Trace enablement alters the contents of the table of
strings within the executable file that contains the names
of the imported DLLs. Although this action does not affect
the functionality of the executable, it does affect its
date and time stamp unless the -P option is specified.
The second feat, trace customizing, is accomplished by
storing the state of the trace customization options in the
operating system's user profile, OS2.INI. The state of
these options can then be retrieved by the trace DLLs when
a trace-enabled executable commences running.
The user can request to log all trace information to an
alternative directory by specifying the -A s option, where
s is the fully qualified drive and path of the directory.
The user can request to log all trace information to the
default directory (same directory as the .EXE/.COM file) by
specifying the -A NONE option. The user can request to
log a maximum number of bytes of level 3 trace information
from buffers by specifying the -B n option, where n is a
decimal number between 16 and 65536 (64KB), inclusive, and
is rounded up to the nearest multiple of 16. The decimal
number can include the 'K' (kilobyte) suffix, in which case
the maximum possible value is 64K. The user can request
to log all level 3 trace information from buffers by
specifying the -B ALL option. The user can request to
enable tracing control (the -PAUSE and -RESUME options) by
specifying the -C ON option. The user can request to
disable tracing control by specifying the -C OFF option.
NOTE: When tracing control is enabled, a thread is created
within the application being traced for the sole purpose of
monitoring pause and resume requests. If this additional
thread is not desired for performance or other reasons,
tracing control should be disabled.
The user can request to trace specific groups of APIs from
DOSCALLS.DLL by specifying the -D g option, where g is ALL
(request all API groups), one or more of the following
delimited by commas (request only specific API groups), or
ALL and one or more of the following each prefixed by a
"NO" and delimited by commas (request all except specific
API groups):
DEV indicates trace device API group
FILE indicates trace file API group
MEM indicates trace memory API group
MISC indicates trace miscellaneous API group
MOD indicates trace module API group
MVDM indicates trace MVDM API group
NLS indicates trace national language support API group
PIPE indicates trace pipe API group
PRF indicates trace performance API group
PROC indicates trace process and thread API group
RES indicates trace resource API group
SEM indicates trace semaphore API group
SES indicates trace session API group
TIME indicates trace date/time and timer API group
XCPT indicates trace exception API group
MSG indicates trace message API group
INFO indicates trace InfoSeg API group
SIG indicates trace signal API group
SMP indicates trace SMP API group
PROF indicates trace DosProfile
The user can request to enable logging of EBCDIC
translation of character buffers by specifying the -E ON
option. The user can request to disable logging of EBCDIC
translation of character buffers by specifying the -E OFF
option.
NOTE: Logging of ASCII translation of character buffers
occurs regardless of the state of the -E option.
The user can request to log a maximum number of bytes of
trace information before log file wrapping (overwriting
from the beginning) occurs by specifying the -F n option,
where n is a decimal number between 4096 (4KB) and 67108864
(64MB), inclusive, and is rounded up to the nearest
multiple of 4096. The decimal number can include the 'K'
(kilobyte) suffix, in which case the maximum possible value
is 65536K, or the 'M' (megabyte) suffix, in which case the
maximum possible value is 64M. The user can request to log
all trace information without log file wrapping by
specifying the -F ALL option.
NOTE: -F ALL appends trace information to the end of any
preexisting trace information file, while -F n erases the
contents of any preexisting trace information file.
NOTE: Setting the log file wrapping length to anything
other than ALL will further impact the performance of the
application being traced, as log file wrapping requires the
log file to be unbuffered, meaning that trace information
cannot be buffered in a memory cache before being written
to disk.
The user can request to trace specific groups of APIs from
PMGPI.DLL by specifying the -G g option, where g is ALL
(request all API groups), one or more of the following
delimited by commas (request only specific API groups), or
ALL and one or more of the following each prefixed by a
"NO" and delimited by commas (request all except specific
API groups):
BIT indicates trace bitmap API group
CORR indicates trace correlation API group
CTRL indicates trace control API group
DEF indicates trace defaults API group
EDIT indicates trace segment editing API group
LCID indicates trace LCID API group
LCT indicates trace logical color table API group
META indicates trace metafile API group
PATH indicates trace path API group
POLY indicates trace polygon API group
PRIM indicates trace primitive API group
RGN indicates trace region API group
SEG indicates trace segment API group
TRAN indicates trace transform API group
DEV indicates trace device API group
The user can request to enable interception of dynamic API
calls by specifying the -I ON option. The user can request
to disable intercaption of dynamic API calls by specifying
the -I OFF option. The user can request to log specific
levels of trace information by specifying the -L n option,
where n is one of the
following:
1 indicates log API entry/exit information
2 indicates log API parameters
3 indicates log API parameter contents
The user can request to enable time stamping of API entries
and exits by specifying the -T ON option. The user can
request to disable time stamping of API entries and exits
by specifying the -T OFF option.
NOTE: API entry time stamps reflect entry into the trace
API, not entry into the actual OS/2 API.
The user can request to have a user-provided procedure
(user hook) called by specifying the -U s option, where s
is of the format DLLNAME.HOOKNAME and HOOKNAME is exported
from DLLNAME by name. A user hook has the following
syntax:
PSZ APIENTRY UserHook( ULONG ulReason
, PSZ pszAPIName
, PVOID pAPIParms
, PVOID pAPIRC
);
A user hook is called under the following circumstances:
Initialization - ulReason = 0
pszAPIName = pAPIParms = pAPIRC = NULL
Termination - ulReason = 1
pszAPIName = pAPIParms = pAPIRC = NULL
API Entry - ulReason = 2
pszAPIName = API name
pAPIParms = Pointer to parameters or
NULL if none
pAPIRC = NULL
API Exit - ulReason = 3
pszAPIName = API name
pAPIParms = Pointer to parameters or
NULL if none
pAPIRC = Pointer to return code or NULL
if none
A user hook can return a pointer to a string that will be
written to the trace information file. The user can
request to not have a user hook called by specifying the -U
NONE option.
NOTE: Because a user hook is a 32-bit procedure, all
parameters are 32-bit aligned, even if they are parameters
to a 16-bit API. For example, when examining a USHORT
parameter being passed to a 16-bit API, the high word may
not necessarily be zero and should be ignored.
NOTE: User hooks are only called for API entries and exits
if the API is being traced AND tracing is not paused.
NOTE: User hooks do not need to be reentrant.
The user can request to trace specific groups of APIs from
PMWIN.DLL by specifying the -W g option, where g is ALL
(request all API groups), one or more of the following
delimited by commas (request only specific API groups), or
ALL and one or more of the following each prefixed by a
"NO" and delimited by commas (request all except specific
API groups):
ACCL indicates trace accelerator API group
ATOM indicates trace atom API group
CLIP indicates trace clipboard API group
CTRY indicates trace country API group
CUR indicates trace cursor API group
DDE indicates trace DDE API group
DESK indicates trace desktop API group
DLG indicates trace dialog API group
DWIN indicates trace WinDefWindowProc
ERR indicates trace error API group
FRAM indicates trace frame API group
HOOK indicates trace hook API group
INPT indicates trace input API group
LOAD indicates trace load API group
MENU indicates trace menu API group
MSG indicates trace message API group (does not include
MSGL group)
MSGL indicates trace WinDispatchMsg and WinGetMsg
PAL indicates trace palette API group
PTR indicates trace pointer API group
RECT indicates trace rectangle API group
SYS indicates trace system API group
THK indicates trace thunk API group
TIME indicates trace time API group
TREC indicates trace track rectangle API group
WIN indicates trace window API group (does not include
DWIN group)
ENV indicates trace WinCatch and WinThrow
HEAP indicates trace heap API group
SEI indicates trace set error info API group
NOTE: DWIN and MSGL are separated from WIN and MSG because
these APIs, when being traced, can severely impact the
performance of the trace-enabled executable.
The user can request to display the current state of the
trace customization options stored in OS2.INI by specifying
the -Q option.
NOTE: No changes are made to the state of the trace
customization options stored in OS2.INI if the -Q option is
specified, even if other customization options are present
on the command line.
The third feat, trace controlling, is accomplished by
creating a thread within the application being traced that
awaits pause and resume requests. When such a request
arrives the thread awakens, pauses or resumes tracing, and
goes back to sleep awaiting the next request.
The user can request to pause tracing by specifying the
-PAUSE option. The user can request to resume tracing by
specifying the -RESUME option.
NOTE: In order for the -PAUSE and -RESUME options to be
effective on a trace-enabled executable, tracing control
must be enabled by specifying the -C ON option before the
executable commences running.
NOTE: A trace-enabled executable can be started while
tracing is paused, as the state of the trace control option
is stored in OS2.INI and retrieved by the trace DLLs when
the executable commences running.
The fourth feat, trace summarizing, is accomplished by
parsing the trace information file generated by a
trace-enabled executable and recording the number of API
entries and exits logged in the file. When finished, the
summary statistics are displayed in alphabetical order to
standard output.
The user can request to summarize the contents of a trace
information file by specifying the -S option.
The user can request helping information by specifying the
-?, -H, or -HELP option.
OS/2 API Trace works on all 32-bit versions of OS/2:
| Major | Minor
Name | Version | Version
------------------------------------+---------+---------
OS/2 Version 2.0x | 20 | 0x
OS/2 Version 2.1x | 20 | 1x
OS/2 Warp Version 3 | 20 | 30
OS/2 Warp Version 4 | 20 | 40
OS/2 Warp Server for e-business | 20 | 45
OS/2 Warp Connect (PowerPC Edition) | 30 | 00
where major and minor versions are the corresponding values
returned from DosQuerySysInfo. Note that the ELF versions
of the executables and trace DLLs are required to run on
OS/2 Warp Connect (PowerPC Edition).
Installation : Place the executable, OS2TRACE.EXE, in a directory along
the PATH environment variable, and place the trace DLLs,
T_*.DLL, in a directory along the system LIBPATH. If a
user hook is provided, the DLL that it resides in must also
be placed along the system LIBPATH.
Usage : Trace enabler -
OS2TRACE -OFF|-ON {-ALL|-dll}... [-P] file
Where:
-OFF indicates disable API tracing
-ON indicates enable API tracing
-ALL indicates enable/disable API tracing for all DLLs
-dll indicates enable/disable API tracing for specific
DLL, where dll can be one of the following:
DOSCALLS HELPMGR KBDCALLS MONCALLS MOUCALLS
MSG NAMPIPES NLS PMBIDI PMCTLS
PMDRAG PMGPI PMMERGE PMPIC PMSHAPI
PMSPL PMVIOP PMWIN PMWP QUECALLS
SESMGR VIOCALLS
-P indicates preserve executable file date/time stamp
file indicates name of executable file to be trace
enabled/disabled
NOTE: Trace enablement alters the contents of the
executable file's import module name table.
In the following example, tracing is enabled in TEST.EXE
for the APIs imported from QUECALLS and SESMGR, and
TEST.EXE's date and time stamp is preserved:
OS2TRACE -ON -QUECALLS -SESMGR -P TEST.EXE
In the following example, tracing is disabled in TEST.EXE
for the APIs imported from all supported DLLs:
OS2TRACE -OFF -ALL TEST.EXE
Trace customizer -
OS2TRACE {-A s|-B n|-C f|-D g|-E f|-F n|
-G g|-I f|-L n|-Q|-T f|-U s|-W g}...
Where:
-A s indicates fully qualified drive and path of
alternative logging directory or NONE for default
directory
-B n indicates log maximum of n bytes from buffers, where
16 ¾ n ¾ 65536 (K suffix allowed) or n is ALL to
indicate log all bytes from buffers
-C f indicates enable (f = ON) or disable (f = OFF)
tracing control (-PAUSE and -RESUME options)
-D g indicates trace specific DOSCALLS API groups, where
g is either ALL[,NOgrp]... or grp[,grp]... and grp
is one of the following:
DEV FILE MEM MISC MOD
MVDM NLS PIPE PRF PROC
RES SEM SES TIME XCPT
MSG INFO SIG SMP PROF
-E f indicates enable (f = ON) or disable (f = OFF)
logging of EBCDIC translation of character buffers
-F n indicates log maximum of n bytes before log file
wrapping occurs, where 4096 ¾ n ¾ 67108864 (K or M
suffixes allowed) or n is ALL to indicate log all
information without log file wrapping
-G g indicates trace specific PMGPI API groups, where
g is either ALL[,NOgrp]... or grp[,grp]... and grp
is one of the following:
BIT CORR CTRL DEF EDIT
LCID LCT META PATH POLY
PRIM RGN SEG TRAN DEV
INK
-I f indicates enable (f = ON) or disable (f = OFF)
interception of dynamic API calls
-L n indicates log level n information, where 1 ¾ n ¾ 3:
1 indicates log API entry/exit information
2 indicates log API parameters
3 indicates log API parameter contents
-Q indicates query current trace customization options
-T f indicates enable (f = ON) or disable (f = OFF) time
stamping of API entries and exits
-U s indicates user hook of the format DLLNAME.HOOKNAME
or NONE for no user hook
-W g indicates trace specific PMWIN API groups, where
g is either ALL[,NOgrp]... or grp[,grp]... and grp
is one of the following:
ACCL ATOM CLIP CTRY CUR
DDE DESK DLG ERR FRAM
HOOK INPT LOAD MENU MSG
PAL PTR RECT SYS THK
TIME TREC WIN ENV HEAP
SEI
NOTE: The default trace customization option settings are:
-A NONE
-B 256
-C OFF
-D ALL
-E OFF
-F ALL
-G ALL
-I OFF
-L 1
-T OFF
-U NONE
-W ALL
In the following example, tracing is customized to log all
trace information to the D:\TRACELOG directory.
OS2TRACE -A D:\TRACELOG
In the following example, tracing is customized to log
a maximum of 512 bytes of level 3 trace information from
buffers:
OS2TRACE -B 512
In the following example, tracing is customized to enable
tracing control (-PAUSE/-RESUME options):
OS2TRACE -C ON
In the following example, tracing is customized to trace
only memory and semaphore API groups from DOSCALLS.DLL:
OS2TRACE -D MEM,SEM
In the following example, tracing is customized to enable
logging of EBCDIC translation of character buffers:
OS2TRACE -E ON
In the following example, tracing is customized to log
a maximum of 16384 (16K) bytes of trace information before
log file wrapping occurs:
OS2TRACE -F 16K
In the following example, tracing is customized to trace
only bitmap, metafile, and transform API groups from
PMGPI.DLL:
OS2TRACE -G BIT,META,TRAN
In the following example, tracing is customized to enable
interception of dynamic API calls:
OS2TRACE -I ON
In the following example, tracing is customized to log
level 2 information:
OS2TRACE -L 2
In the following example, the current state of the trace
customization options stored in OS2.INI is displayed:
OS2TRACE -Q
In the following example, tracing is customized to enable
time stamping of API entries/exits:
OS2TRACE -T ON
In the following example, tracing is customized to call
user hook MyHook() in MYDLL.DLL:
OS2TRACE -U MYDLL.MyHook
In the following example, tracing is customized to trace
all except hook and system API groups from PMWIN.DLL:
OS2TRACE -W ALL,NOHOOK,NOSYS
Trace controller -
OS2TRACE -PAUSE|-RESUME
Where:
-PAUSE indicates pause API tracing
-RESUME indicates resume API tracing
In the following example, tracing is paused:
OS2TRACE -PAUSE
In the following example, tracing is resumed:
OS2TRACE -RESUME
Trace summarizer -
OS2TRACE -S file
Where:
-S indicates summarize API tracing
file indicates name of trace information file to be trace
summarized
In the following example, tracing in TEST.TRC is summarized
and placed in TEST.SUM:
OS2TRACE -S TEST.TRC > TEST.SUM
Scenario : The following example shows a typical scenario where the
several personalities of OS2TRACE can be used in conjuction
to produce a summary of NLS APIs used by TEST.EXE:
OS2TRACE -D NLS -L 1
OS2TRACE -ON -DOSCALLS -NLS TEST.EXE
TEST
OS2TRACE -OFF -DOSCALLS -NLS TEST.EXE
OS2TRACE -S TEST.TRC > TEST.NLS
The first line customizes API tracing, the second line
enables API tracing, the third line invokes the executable,
which places all its API tracing information in TEST.TRC,
the fourth line disables API tracing, and the fifth line
summarizes API tracing.
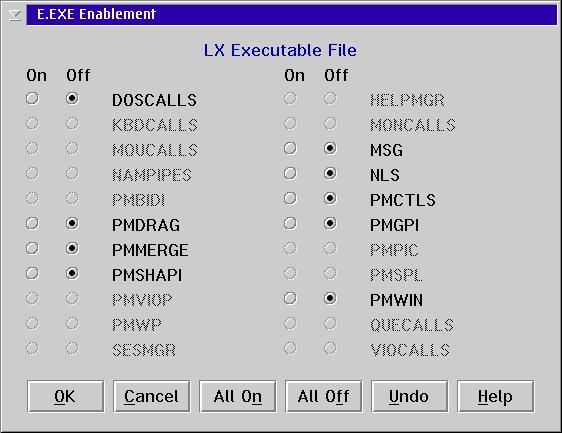
Output : Trace enabler -
If the user requests enablement of API tracing (-ON
option), information similar to the following is displayed
for each requested DLL that is imported by the executable
file:
DLLNAME : File imports from DLL, API tracing enabled
information similar to the following is displayed for each
requested DLL whose trace DLL is already imported by the
executable file:
DLLNAME : File imports from trace DLL, API tracing already
enabled
information similar to the following is displayed for each
requested DLL that is not imported by the executable file:
DLLNAME : File does not import from DLL, API tracing not
enabled
information similar to the following is displayed for each
requested DLL that has an unsupported API name imported by
the executable file:
DLLNAME : File imports APINAME by name, API tracing cannot
be enabled
and information similar to the following is displayed for
each requested DLL that has an unsupported ordinal imported
by the executable file:
DLLNAME : File imports unsupported ordinal N, API tracing
cannot be enabled
If the user requests disablement of API tracing (-OFF
option), information similar to the following is displayed
for each requested trace DLL that is imported by the
executable file:
DLLNAME : File imports from trace DLL, API tracing disabled
information similar to the following is displayed for each
requested trace DLL whose DLL is already imported by the
executable file:
DLLNAME : File imports from DLL, API tracing already
disabled
and information similar to the following is displayed for
each requested trace DLL that is not imported by the
executable file:
DLLNAME : File does not import from trace DLL, API tracing
not disabled
Trace customizer -
If the user requests customization of API tracing (-A, -B,
-C, -D, -E, -F, -G, -I, -L, -T, -U and/or -W options),
information similar to the following is displayed:
Old trace customization options:
-A D:\ -B 64 -C OFF -D ALL -E ON -F 8192 -G DEV,INK ...
New trace customization options:
-A NONE -B 256 -C ON -D MEM,SEM -E ON -F ALL -G ALL ...
The first two lines contain the state of the trace
customization options prior to the invocation of OS2TRACE
while the last two lines contain the state of the trace
customization options after the invocation of OS2TRACE.
Trace controller -
If the user requests pausing of API tracing (-PAUSE
option), information similar to the following is displayed
if tracing is not already paused and there are active
trace-enabled applications that were started while tracing
control was enabled (-C ON option):
Tracing paused
C:\OS2\E.EXE (PID 0F1C) paused
information similar to the following is displayed if
tracing is not already paused and there are no active
trace-enabled applications there were started while tracing
control was enabled (-C ON option):
Tracing paused
No active trace-enabled applications
and information similar to the following is displayed if
tracing is already paused:
Tracing already paused
If the user requests resuming of API tracing (-RESUME
option), information similar to the following is displayed
if tracing is not already resumed and there are active
trace-enabled applications that were started while tracing
control was enabled (-C ON option):
Tracing resumed
C:\OS2\E.EXE (PID 0F1C) resumed
information similar to the following is displayed if
tracing is not already resumed and there are no active
trace-enabled applications there were started while tracing
control was enabled (-C ON option):
Tracing resumed
No active trace-enabled applications
and information similar to the following is displayed if
tracing is already resumed:
Tracing already resumed
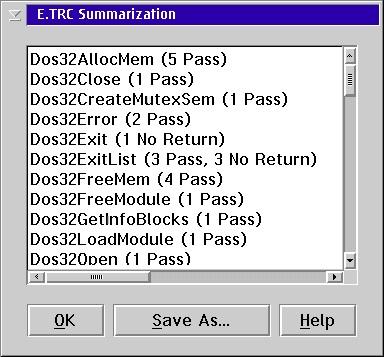
Trace summarizer -
If the user requests summarization of the contents of a
trace information file (-S option), information similar to
the following is displayed:
Used APIs:
APINAME (12 Pass, 4 Fail, 1 Indeterminate, 2 No Return)
Each line contains the name of the used API, the number of
successful invocations, if any, the number of unsuccessful
invocations, if any, the number of indeterminate
invocations, if any, and the number of API entries without
matching exits (indicated by "No Return"), if any. It
should be noted that these APIs are listed in alphabetical
order.
NOTE: A warning message is issued if summarization
information may not be accurate due to lost API
entries/exits, pausing/resuming trace, or file wrapping.
Trace-enabled executable -
All levels of information, from the trace-enabled .EXE/.COM
and/or any trace-enabled .DLLs that are attached to the
.EXE/.COM, are logged to a text file with a file name that
matches the .EXE/.COM file name and an extension of .TRC.
This trace information file resides in the same directory
as the .EXE/.COM file or the alternative directory, if one
exists. If another instance of the same .EXE/.COM is
already running or the text file is already open in the
alternative directory, the file name of the text file is
changed to PROC followed by the hexadecimal process
identifier (i.e. PROC003A.TRC). If this occurs, a warning
message is issued.
NOTE: If a REXX program loads any trace-enabled .DLLs, all
trace information is logged to CMD.TRC in the same
directory as the CMD.EXE executable that loaded the REXX
program or the alternative directory, if one exists.
If the user requests level 1 information, data similar to
the following is logged for each API call:
003A 0001 | Dos32CreateQueue Entry
003A 0001 | Dos32CreateQueue Exit
PASS | Return code: 0
If the user requests level 2 information, data similar to
the following is logged for each API call:
003A 0001 | Dos32CreateQueue Entry
| Parameter 1: PHQUEUE = 0x00028BE8
| Parameter 2: ULONG = 0x00000002
| Parameter 3: PSZ = 0x000200A4
003A 0001 | Dos32CreateQueue Exit
PASS | Return code: 0
| Parameter 1: PHQUEUE = 0x00028BE8
If the user requests level 3 information, data similar to
to the following is logged for each API call:
003A 0001 | Dos32CreateQueue Entry, Return Address =...
| Parameter 1: PHQUEUE = 0x00028BE8
| Parameter 2: ULONG = 0x00000002
| Parameter 3: PSZ = 0x000200A4 ["\QUEUES\..."]
003A 0001 | Dos32CreateQueue Exit
PASS | Return code: 0 (NO_ERROR)
| Parameter 1: PHQUEUE = 0x00028BE8 [0x00000007]
The first number on both the API entry and exit lines is
the hexadecimal process identifier (PID) of the executable.
The second number is the hexadecimal thread identifier
(TID) of the thread within the executable that invoked the
API.
If the user requests level 3 information and a character,
ASCIIZ string, integer, color, FIXED, POINTL, RECTL,
WPOINT, or user-defined buffer is larger than the maximum
specified by the -B n option, the data is truncated and
-- More -- is logged.
If log file wrapping occurs, information similar to the
following is logged after the executable's stopping time,
OS2TRACE banner, and executable's starting time:
< Trace information lost due to log file wrapping n times >
If the length of an API's entry/exit information is greater
than the log file wrapping length, information similar to
the following is logged in lieu of the entry/exit:
< API entry/exit information lost >
If interception of dynamic API calls is enabled,
information similar to the following is logged after each
Dos16GetProcAddr and/or Dos32QueryProcAddr call that loads
an API within a supported DLL that is enabled for tracing:
< Intercepting ordinal n in module DLLNAME >
NOTE: Dos16GetProcAddr and Dos32QueryProcAddr do NOT have
to be traced in order to intercept dynamic API calls, but
DOSCALLS must be enabled for tracing.
If the user requests to trace the DOSCALLS SMP API group
and the version of OS/2 is not the multiprocessing version,
information similar to the following is logged after each
SMP API call:
< Returning n for API not present on this version of OS/2 >
If the user requests to trace the DOSCALLS SEM API group
and a semaphore API removed by the Convenience Package for
Warp Server for e-business is called, information similar
to the following is logged:
< Returning n for API removed by WSeB Convenience Package >
If tracing is paused when the executable commences running,
information similar to the following is logged:
< Tracing initially paused >
If tracing is paused while the executable is running,
information similar to the following is logged:
< Pausing trace at nn:nn:nn.nn >
If tracing is resumed while the executable is running,
information similar to the following is logged:
< Resuming trace at nn:nn:nn.nn >
If the user requests to have a user hook called and the
hook returns a valid string, information similar to the
following is logged:
<+ DLLNAME.HOOKNAME(n): string +>
All warning and error messages generated by the
trace-enabled executable are placed in the error message
file OS2TRACE.ERR in the root directory of the operating
system's boot drive in order to avoid conflicts with the
executable's output.
History : Version Date Item
2.30.00 12Jun95 Created (supported LX format and 32-bit Dos
APIs only)
2.30.01 09Jul95 Issued warning if trace DLL not on LIBPATH
2.30.02 18Jul95 Added optional "NO" prefix to API groups
2.30.03 20Jul95 Added 32-bit Win APIs
2.30.04 28Jul95 Fixed integer buffer logging
2.30.05 04Aug95 Added 32-bit Gpi APIs
2.30.06 09Aug95 Fixed Dos32DevIOCtl bug
2.30.07 11Aug95 Changed to new build structure
2.30.08 11Aug95 Added 32-bit Ddf APIs
2.30.09 12Aug95 Added 32-bit Dev APIs
2.30.10 13Aug95 Added 32-bit Drg APIs
2.30.11 14Aug95 Added 32-bit Prf APIs
2.30.12 25Aug95 Fixed Dos32QueryMessageCP bug
2.30.13 27Aug95 Added OS/2 for PowerPC support
2.30.14 29Aug95 Added 32-bit Prt and Spl APIs
2.30.15 29Aug95 Added 32-bit Pic APIs
2.30.16 22Sep95 Enhanced -B option
2.30.17 22Sep95 Added -F option
2.30.18 24Sep95 Added -T option
2.30.19 02Nov95 Fixed Drg32DragFiles bug
2.30.20 27Nov95 Added support for Dos APIs in MSG, NLS,
QUECALLS, and SESMGR exported by DOSCALLS
2.30.21 13Dec95 Forwarded private entry table ordinals
2.30.22 19Dec95 Added new OS/2 3.00 non-Uni Dos APIs
2.30.23 27Mar96 Fixed PMWIN bugs
2.30.24 29Mar96 Added PM interface (supported customization
and help only)
2.30.25 15Apr96 Verified DOS header new header file address
2.30.26 23May96 Issued more specific enablement messages
2.30.27 13Jun96 Logged FEA2 structure EA value
2.30.28 14Jun96 Changed "\r\n" to "\n" in output
2.30.29 21Jun96 Fixed Dos32UnwindException bug
2.30.30 26Jun94 Added OS/2 2.00 PM debugger APIs
2.40.00 05Sep96 Added new OS/2 2.40 APIs
2.40.01 27Sep96 Fixed customization information display bug
2.40.02 11Mar97 Removed loading/unloading trace DLLs from
.EXE
2.40.03 11Mar97 Converted to IBM VisualAge C++
2.40.04 12Mar97 Fixed OS/2 for PowerPC DLL support
2.40.05 12Mar97 Added enablement support to PM interface
2.40.06 12Mar97 Fixed Win32EnumObjectClasses bug
2.40.07 13Mar97 Added customization cancel confirmation
2.40.08 13Mar97 Added summarization support to PM interface
2.40.09 14Mar97 Removed summarization API exit without
entry error
2.40.10 14Mar97 Fixed Dev32StdOpen bug
2.40.11 19Mar97 Added save window position option to PM
interface
2.40.12 19Mar97 Added support for NE format
2.40.13 20Mar97 Added launch .EXE files option to PM
interface
2.40.14 25Mar97 Fixed DENA2 buffer logging
2.40.15 01Apr97 Fixed Dos32FindFirst bug
2.40.16 15Apr97 Removed OS/2 for PowerPC from PM help
2.40.17 21Apr97 Added 16-bit Dos APIs
2.40.18 30Apr97 Added 16-bit Kbd APIs
2.40.19 01May97 Added 16-bit Mou APIs
2.40.20 05May97 Added 16-bit Vio APIs
2.40.21 20May97 Fixed/minimized 16-bit stack usage
2.40.22 22May97 Added FAQ
2.40.23 27May97 Linked .EXEs with proper threaded C library
2.40.24 03Jun97 Added FAQ to PM interface help submenu
2.40.25 04Jun97 Fixed 16-bit registers structure init bug
2.40.26 24Jun97 Added 16-bit Win APIs
2.40.27 22Jul97 Added 16-bit Gpi APIs
2.40.28 06Aug97 Added 16-bit Dev APIs
2.40.29 07Aug97 Added 16-bit Drg APIs
2.40.30 08Aug97 Added 16-bit Pic APIs
2.40.31 08Aug97 Logged user-defined buffer initial bytes
2.40.32 11Aug97 Added 16-bit Prf APIs
2.40.33 11Aug97 Added 16-bit Prt APIs
2.40.34 13Aug97 Added 16-bit DosPrint and Spl APIs
2.40.35 13Aug97 Fixed Spl32EnumDevice/Spl32EnumQueue bug
2.40.36 14Aug97 Added -I option
2.40.37 15Aug97 Fixed Vio16GetPhysBuf bug
2.40.38 15Aug97 Added TRACE-IT batch file
2.40.39 17Sep97 Fixed 16-bit DosProtect APIs bug
2.40.40 12Jan98 Enhanced performance
2.40.41 12Jan98 Fixed Dos16GetInfoSeg bug
2.40.42 23Jan98 Added PRQINFO8 structure
2.40.43 23Jan98 Fixed Dos16PrintQSetInfo/Spl32SetQueue bug
2.40.44 27Jan98 Fixed returned MRESULT thunk bug
2.40.45 28Jan98 Added indeterminate API return codes
2.40.46 28Jan98 Fixed summarization alphabetical API bug
2.40.47 29Jan98 Added Win16DefAVioWindowProc
2.40.48 30Jan98 Fixed Win16Catch bug
2.40.49 04Feb98 Added OS2TRACE.API text file
2.40.50 06Feb98 Fixed CX and DX corruption by 16-bit Kbd,
Mou, and Vio APIs
2.40.51 18Feb98 Verified saved window position origin on
desktop
2.40.52 16Mar98 Fixed file dialog root directory bug
2.40.53 16Mar98 Fixed file dialog clean up bug
2.40.54 16Mar98 Changed main window identifier to 1
2.40.55 02Jun98 Fixed DevQueryHardcopyCaps bug
2.40.56 02Jun98 Changed default selection for cancellation
dialog to "No"
2.40.57 25Jun98 Added trace-enabled executable checker
2.40.58 01Jul98 Added version checking to trace DLLs
2.40.59 06Jul98 Added bitmaps of dialogs to PM help
2.40.60 08Jul98 Added title/action bar only option to PM
interface
2.40.61 17Aug98 Added SMP Dos APIs
2.40.62 18Aug98 Removed unnecesary semaphore nesting in
DosFindFirst/DosFindClose
2.40.63 19Aug98 Fixed -F option
2.40.64 21Aug98 Added bitmap of logo to PM help
2.40.65 28Aug98 Added monitor trace options to PM interface
2.40.66 09Sep98 Added private profile Dos APIs
2.40.67 24Sep98 Removed unloading trace DLLs from .DLLs
2.40.68 12Oct98 Fixed/enhanced helping information
2.40.69 21Oct98 Forwarded removed entry table ordinals
2.40.70 21Oct98 Added miscellaneous Dos APIs
2.40.71 22Oct98 Added PM AVIO Vio APIs
2.40.72 22Oct98 Moved Prt/Spl APIs loading to OS/2 2.30
2.40.73 26Oct98 Fixed Dos32GetMessage/Dos32QueryMessageCP
bug
2.40.74 27Oct98 Added WinSetErrorInfo
2.40.75 28Oct98 Added Gpi/Win APIs exported from PMBIDI
2.40.76 28Oct98 Issued more specific trace DLL load errors
2.40.77 28Oct98 Added Win32MessageBox2
2.40.78 16Nov98 Added miscellaneous Dos APIs
2.40.79 24Nov98 Fixed Dos32QueryModFromEIP usage bug
2.40.80 02Dec98 Added undocumented -DUMPSTACK option
2.40.81 02Dec98 Added -E option
2.40.82 07Dec98 Fixed stack dump at DosExit bug
2.40.83 12Jan99 Enhanced trace monitoring
2.40.84 20Jan99 Fixed monitor trace options dialogs bugs
2.40.85 21Jan99 Added -P option
2.40.86 03Mar99 Added support for executables without DOS
header
2.40.87 23Mar99 Fixed 16-bit SMP Dos APIs loading bug
2.45.00 15Apr99 Added new OS/2 2.45 APIs
2.45.01 02May99 Added support for Gpi/Win APIs in PMGPI,
PMSHAPI, and PMWIN exported by PMMERGE
2.45.02 02May99 Fixed WinQueryWindowText bug
2.45.03 02May99 Added support for Drg APIs in PMDRAG
exported by PMCTLS
2.45.04 05May99 Added -Q option
2.45.05 09May99 Added support for K and M suffixes to -B
and -F options
2.45.06 16May99 Added support for KB and MB values to PM
interface
2.45.07 21May99 Fixed Dos32Debug bug
2.45.08 11Jun99 Added support for .COM files
2.45.09 11Jun99 Logged Dos16DevIOCtl(2) output buffers
2.45.10 02Aug99 Moved common strings into T_COMMON
2.45.11 03Aug99 Logged name of module containing API being
intercepted
2.45.12 01Feb00 Displayed customization options on new line
2.45.13 01Feb00 Logged PID in errors and warnings
2.45.14 02Feb00 Saved OS2.INI information only when changed
2.45.15 08Feb00 Standardized output
2.45.16 18Feb00 Added -C, -PAUSE, and -RESUME options
2.45.17 21Feb00 Added restore window position option to PM
interface
2.45.18 28Feb00 Removed import by name restriction
2.45.19 29Feb00 Fixed trace monitoring without background
font
2.45.20 29Feb00 Fixed control semaphore IPE under OS/2 2.00
2.45.21 29Feb00 Fixed resizing main window with zero height
twice during trace monitoring
2.45.22 01Mar00 Removed drawing background font if bitmap
calculation too long
2.45.23 24May00 Handled running out of disk space
2.45.24 01Jun00 Added -A option
2.45.25 03Jun00 Added trace information file API stripper
2.45.26 10Jan01 Handled OS/2 2.45 APIs removed by WSeB CP
2.45.27 05Jun01 Fixed Dos32CreateThread bug
2.45.28 14Jun01 Fixed Dos16(Protect)QFileInfo bug
2.45.29 19Jun01 Added enter key support to PM interface
2.45.30 22Jun01 Fixed Dos32UnwindException bug
2.45.31 26Jun01 Added capability of building 32-bit only
trace DLLs
2.45.32 28Jun01 Added -U option
2.45.33 29Jun01 Added Win APIs exported from PMSHAPI not in
public include file
2.45.34 10Jul01 Moved C run-time functions into T_COMMON
2.45.35 02Dec03 Fixed Dos16CreateThread bug
2.45.36 03Dec03 Fixed WinSetErrorInfo user hook bug
2.45.37 30Apr09 Fixed error-to-string bugs
2.45.38 04May09 Added Dos32DumpProcess errors
2.45.39 10Oct10 Preserved FS in T_GetTID
2.45.40 25Oct10 Fixed PEAOP/PEAOP2 bug
Please direct all comments, problems, questions, and suggestions to the
author above. |
 www.angelfire.com/tx4/blaschke/OS2Trace/OS2TRACE.ZIP www.angelfire.com/tx4/blaschke/OS2Trace/OS2TRACE.ZIP |
local copy
|
Record updated last time on: 26/01/2026 - 06:29

This work is licensed under a Creative Commons Attribution 4.0 International License.
Contact us! (webform or ecsoft2 [dot] org![]() gmail [dot] com (email))
gmail [dot] com (email))
Add new comment